Queuing Theory with Excel pt2

The previous blog post showed the formulas that are used in M/M/c queuing models, and finished by showing that we need an Excel formula for \sum\limits_{a}^{b} if we are going to use Excel to help us.

The previous blog entry also introduced us to
c = the number of servers, and
\rho = the average utilisation

Excel does have a function “Poisson” which is defined as
Poisson(x,mean,cumulative)
Where
x is the number of events ("servers" in queuing terminology)
mean is the expected numerical value ("servers in use" in queuing terminology)
cumulative is a Boolean value indicating whether to return the sum of the Poisson probability (TRUE) or the exact probability (FALSE)

So
Poisson(c , c\rho , false) = \frac{e^{-c\rho} c\rho^c}{c!}
Poisson(c , c\rho , true) = \sum\limits_{n=0}^{c} \frac{e^{-c\rho} c\rho^c}{n!}

Warning!!!!

The Microsoft help for poisson shows the cumulative formula using an incredibly poor image... They show the cumulative equation as:
= \sum\limits_{k=0}^{x} \frac{e^{-\lambda} \lambda^\wedge}{k!}

That \wedge symbol isn't clear whether it is the bottom half of an x , \lambda  or k .  It is actually a k however many websites have erroneously shown it as an x , and therefore care should be taken to ensure that you use the cumulative poisson function of Excel correctly.

Back to our formula
Remember our target equation?

\wp_0 = \biggl [1 +\frac{(c\rho)^c}{c! (1-\rho)} + \sum\limits_{n=1}^{c-1} \frac{(c\rho)^n}{n!} \biggr]^{-1}

In Excel, we can use the psuedo-formula
=Poisson(c ,c\rho ,false)  *  exp(c\rho )  /  (1-\rho)

Which (when written algebraically) is the following
\frac{e^{-c\rho} c\rho^c}{c!} \frac{e^{c\rho}}{(1-\rho)}

We can simplify this to the following
\frac{e^{-c\rho} c\rho^c e^{c\rho}} {c! (1-\rho)}

Since
e^{c\rho} * e^{-c\rho} = 1

We can reduce this further to the following
\frac{c\rho^c}{c!(1-\rho)}

That’s the middle part of our \wp_0 = equation.. so we're halfway there.

Stage 2
The second stage is achieved as follows:

In Excel, we can use another psuedo-formula
=Poisson(c ,c\rho ,true) * exp(c\rho )

Which is the following
\sum\limits_{n=0}^{c} \frac{e^{-c\rho} c\rho^n}{n!} * e^{c\rho}

Since e^{-c\rho} is used in every part of that Sigma for every value for “n”, and doesn’t change, we can take it outside the sum and use it as a multiplier.

This changes the equation to:
e^{-c\rho} * \sum\limits_{n=0}^{c} \frac{c\rho^n}{n!} * e^{c\rho}

Also e^{c\rho} * e^{-c\rho} = 1

So we can reduce the equation to the following
\sum\limits_{n=0}^{c} \frac{c\rho^n}{n!}

But look carefully at the \wp_0 = equation above. We need n=1 as the starting point of the sum, not n=0. We can achieve this by rewriting the above sum, but extract the n=0 point individually.

\frac{c\rho^0}{0!} + \sum\limits_{n=1}^{c} \frac{c\rho^n}{n!}

Since 0! = 1, and anything to the power of 0 = 1, this is the same as saying
1 + \sum\limits_{n=1}^{c} \frac{c\rho^n}{n!}

Ah... I thought it was too easy
That very simple Excel formula of =Poisson(c ,c\rho ,true) * exp(c\rho ) hasn't quite given us everything we needed. The SUM goes all the way to n=c however our original formula for the M/M/c queue \wp_0 only needed n=c-1. So we need to take that "top value" off of our nice Excel formula
=Poisson(c ,c\rho ,true) * exp(c\rho ) - \frac{c\rho^c}{c!}

Hang on. We've dealt with a formula like that already. We can re-use the lessons learnt in stage 1, to say that the Excel formula of
=Poisson(c ,c\rho ,false) * exp(c\rho )

When written algebraically, is the following
\frac{e^{-c\rho} c\rho^c}{c!} * e^{c\rho}

Simplified to the following
\frac{e^{-c\rho} c\rho^c e^{c\rho}} {c!}

Reduced to
\frac{c\rho^c}{c!}

That's what we needed.

Put it all together

So in Excel
Stage 1 + Stage 2 - Stage 3
Poisson(c ,c\rho ,false)*exp(c\rho )/(1-\rho ) + Poisson(c ,c\rho ,true)*exp(c\rho ) - Poisson(c ,c\rho ,false)*exp(c\rho )

Is equal to
1 + \frac{c\rho^c}{c!(1-\rho)} + \sum\limits_{n=1}^{c-1} \frac{c\rho^n}{n!}

Ah, but.... The \wp_0 equation is all to the minus 1, and we haven't got that (yet). This is simply resolved.

The Excel formula of 1/(Poisson(c ,c\rho ,false)*exp(c\rho )/(1-\rho ) + Poisson(c ,c\rho ,true)*exp(c\rho ) - Poisson(c ,c\rho ,false)*exp(c\rho ))

Is equal to
\biggl [1 + \frac{(c\rho)^c}{c!(1-\rho)} + \sum\limits_{n=1}^{c-1} \frac{(c\rho)^n}{n!} \biggr]^{-1}=\wp_0

Now you have the "tricky" \wp_o value, all other values in the M/M/c queuing theory are MUCH easier to calculate.

This may have appeared to be a long and tortuous route, but now we have proved it once, we never need to do it again... we can just use the Excel Poisson formula in our queuing models knowing exactly how it can be applied correctly.

Phew!

Posted in Blog Posts, Capacity Management | Tagged , , , , , , , , , , | Leave a comment

Queuing Theory with Excel pt1

Capacity Planning makes extensive use of Queuing theory to predict future response times of a system when the workload increases.  There are many tools available that will automatically calculate the queues and can do multi-variate planning. However, if you have a really simple system and no money to buy a dedicated toolset, what can you do?

The formulas are reproduced across the internet and in books, so anyone can use them, however using a calculator/pen&paper is quite a challenge for this piece of mathematics. Lets have a look at the formulas involved.

We're interested in the M/M/c queue which is described in wonderful detail in Wikipedia here: (Queuing theory)
(Multi-server queue model)

I will assume that you either understand those pages, or have read them and are happy NOT to understand them!

Just to bring out the essential equations from those pages:

M/M/c Queue
\lambda = arrival rate per unit of time
\mu = service rate per unit of time
c= number of servers

Note:
Most people are familiar with a "Service Time", e.g. how many seconds does it take to service a particular request. Service rate per unit of time is calculated from the “Service Time” as in the following example:
If the service time is 20 seconds, then the service rate per minute is 60/20 = 3
The service rate per hour is 3600/20 = 180
So. The “Service Rate” is effectively the “number of services that can be performed in the given unit of time”.

The Average Utilisation (U) is also known as the Traffic Intensity (\rho)given as:
U= \frac {\lambda}{(c\mu)} = \rho

The system is stable if the Utilisation is less than 1 (100%). Well, if the utilisation is above 100%, then that would be pretty "unstable"... unlike in sport - computer systems can't give 110% percent!!

The formulas continue:
Probability of there being ZERO jobs in the system

\wp_0 = \biggl [1 +\frac{(c\rho)^c}{c! (1-\rho)} + \sum\limits_{n=1}^{c-1} \frac{(c\rho)^n}{n!} \biggr]^{-1}

Probability of there being “n” jobs in the system

If n<c

\wp_n = \wp_0 \frac{(c\rho)^n}{n!}

If n>=c

\wp_n = \wp_0\frac{\rho^n c^c}{c!}

The probability of queuing is
\varrho = \wp_0 \frac{(c\rho)^n}{c!(1-\rho)}

Mean response time is
r = \frac{1}{\mu} (1+\frac{\varrho}{c(1-\rho)})

So \rho depends on \wp_0 and in fact, so does almost everything… so how can Excel work this out?

\wp_0 is a long summation that has a \sum in it. Excel doesn't seem to have that as a simple function.

We'll find out how, in the next post... probably best to make sure that the above formulas are either understood, or at least accepted!

Posted in Blog Posts, Capacity Management | Tagged , , , , , , | Leave a comment

Does the 'Cloud' negate the need for Capacity Management?

* Capacity planning is the thing that stands out as the biggest advantage of the Microsoft cloud model. The Windows Azure platform takes that out of the equation for us, unlike the other cloud providers. *
  Jonathan Malek
Chief Architect and Director of Research, Associated Press

The above quotation is taken from a Microsoft case study http://www.microsoft.com/casestudies/Case_Study_Detail.aspx?casestudyid=4000005887

But is it REALLY true?

In another part of the Microsoft website, they say

See how Windows Azure helped the AP develop a new global API through easy scalability that removed the need for costly and time-consuming capacity planning. http://www.microsoft.com/en-us/cloud/tools-resources/casestudy.aspx?resourceId=Associated_Press&fbid=Be4qy4YrM4Q

Looking at the first quotation, it is possible to unpick the words to get at the truth.  Simply moving from in-house IT infrastructure onto a "cloud" merely shifts the effort of Resource Capacity Management (that is: managing the infrastructure) from the business over to the Cloud provider.  Business and Service Capacity Management (that is: managing the business and service quality) still needs to be done.  Someone has to work out when the existing deployment will become insufficient to provide a good quality of service and therefore needs to be upgraded.  Being in a "Cloud" merely means that this has apparently become the job of the "Cloud" provider, rather than the business owner.

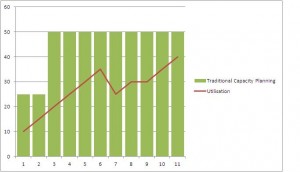
But wait, (I hear you cry), my "Cloud" provider has shown me the graphs that explain how being in the "Cloud" means that I will always have exactly the capacity I need on demand.  A typical graph that is shown by the salesmen and marketeers is like this:

Traditional Capacity Planning

Capacity Planning traditionally provides the resource that the business needs in a timely manner.  'Cloud' providers will point to the area above the line to show that capacity has been purchase that isn't immediately used.  They will tell you how this is wasteful.
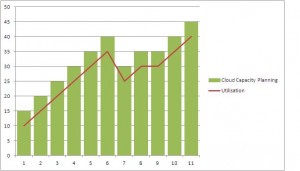
Instead, they will champion their own solution:

Cloud Capacity Planning

The 'Cloud' provider will now show how, by always providing a set percentage MORE capacity than is actually required, they can maintain that margin of "headroom" and thereby save the business a lot of money.  

Now, I would ask..

What happens when an application goes 'rogue'?

In the traditional Capacity Planning model, a rogue process will continue to consume resources until it fills a system.  At this point, the support teams will hopefully notice something and restart the application.  However, in the 'Cloud' model, the rogue process will consume all resources until it reaches the "headroom" margin that has been set.  The 'Cloud' will then give the application even more resource, which the application will consume, at which point the 'Cloud' will give even more resource.. which will be consumed.  This will never end.

Of course... this would never happen, would it?  After all, the Cloud provider would never just shovel more resources at a rogue application?  Well.  Unless there is someone manually checking things, then how will they ever tell the difference between an application going rogue, and the business being highly (and suddenly) successful?  Imagine the launch of the Ipad 3.  That will generate a huge hit on eCommerce systems that will certainly look like a rogue process, but will actually be many millions of people wanting to be the first to order/own the device.

Given the first quotation at the very top of this article, I can agree to a limited extent that "The Windows Azure platform takes that [Capacity Planning] out of the equation for us".  Of course it has taken some of the Capacity Planning out of the equation for the customer... because predicting IT resources now resides on the desk of the 'Cloud' supplier.  They are the ones that need to judge whether the sudden increase in activity is down to a rise in business activity, or due to a failure of an application.  However they aren't privvy to any business forecasts.

The only sure-fire way of knowing in advance which of the two it is, is by Capacity Management.  You see, Capacity Management isn't some "Techno-geek" activity that is buried in the dungeons of a production support team.  Capacity Management is the activity that links the Business Planning to the IT department.  It seems strange that businesses should go to all that trouble of actually planning what they are going to do, how they are going to do it, and why, only for the IT department to ignore all of that meticulous planning and just guess that the 'Cloud' will be able to support them.  In fact.  I would suggest that it is the attitude of the 'Cloud' providers that is going to end up being "costly and time consuming" to the business. 

How will the business ever plan its budgets without a clear idea of the future IT expenditure?  If a business cannot plan its outgoings, then how will it know whether a particular product or service is going to be profitable?  The IT department aren't going to be much help with this, because they have washed their hands of any Capacity Management and now at the mercy of the reactive model imposed upon them by the 'Cloud' provider.

Microsoft claim that their 'Cloud' provides "easy scalability that removed the need for costly and time-consuming capacity planning".  I would advise this:  You'll only really comprehend the VALUE of capacity planning, when you suffer the COST of not doing it.

Posted in Blog Posts, Capacity Management | Tagged , , , , , , , , , | Leave a comment