How would you improve IR35 administration?

How do you solve a problem like Maria?

That was the question at the beginning of the Sound of Music. It was the anguished cry of the Nuns when faced with someone that just didn't fit in, was at odds with everyone else, and was basically not working out the way that they should. Is it too much of a leap of thought to imagine George Osborne walking through the corridors of the Treasury Ministry flanked by officials from the OTS and HMRC humming the same tune whilst wondering.. "How do you solve a problem like IR35?".

IR35 is a millstone around the neck of HMRC. They wanted to bring it in, because it seemed like it was a simple way to increase the tax yield. It seemed so obvious; freelancers weren't employees but they certainly weren't big multi-national companies either. To the ignorant eye they "looked" like employees so let's tax them like employees. It should have been simple. These individual tax payers should have just paid up when asked. However it wasn't like that in reality. The law showed that freelancers are NOT employees, and apart from a few isolated miscarriages of justice, IR35 doesn't actually work.

Too much time has passed now, and IR35 is too "public" a measure to just repeal. So the "Mother Abbess" George has decided that HMRC should solve the problem of IR35 by administering it better.

But what does that mean?

The legislation isn't fit for purpose, it doesn't actually hit any targets (when it is applied lawfully), so how can it be administered better? It would be easier to rip it up and start again.. well.. maybe just rip it up!

In my opinion, the best way to administer IR35 better, would be to create a simple test as a first stage, and if that test is passed then IR35 is not pursued any further for that freelancer. However.. what could that "test" be?

- More than 1 client in the history of the business?
- Membership of a professional trade body?
- Have the trappings of business? (VAT registration, Corporate accounts, Marketing paraphernalia?)

What do you think?

Posted in Blog Posts, Freelancing | Tagged , , , , , , , , , , , | Leave a comment

Better than average?

How busy is a system?

If one could measure a system at the most detailed level, then a system would either be busy doing "something" or it would be idle doing "nothing". Curiously enough, moving from this fact to the reporting of system utilisation is beyond some of the people that I have met over the years.

If a system is reported as being 50% busy, then there are IT "professionals" out there that cannot comprehend how this can be. As we've already said, at the finest granularity the system is either busy (100% utilised) or idle (0% utilised). It is a simple enough concept to appreciate that if the system is reported as 50% busy, then for half of the period for which it is being reported it was idle and for the other half of the time it was fully busy.

Understanding this concept leads naturally to understanding how a system can be 67.4% busy, or 17% busy, etc, etc.

So... a major facet of system reporting that must be understood is the time interval over which the reporting is taking place. Is the system 67% busy over a minute, hour, or day? What is actually being reported is the AVERAGE utilisation over that time period.

Averages can be really useful and are used extensively in statistical reporting in all walks of life. However, sometimes, they can be misleading. It is said that, on average, each family has 2.4 children. I’ve checked all the people I know, and none of them have 0.4 of a child (although many have either 2 or 3 children). As you can see, the average gave a rough indication of the number of children, but no more than that.

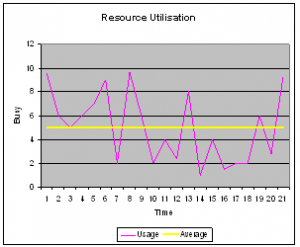
When considering resource utilisation, reporting that a system is 50% busy is effectively saying that for half of the interval the system was less than 50% busy, but for the other half it was more than 50% busy.

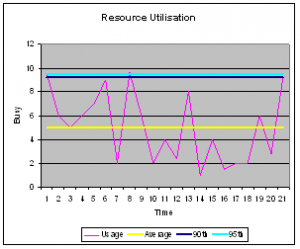
A more appropriate measurement that can be used for resource utilisation is the percentile. The average that was described above is effectively the 50th percentile. That is, it identifies the value at which you can state that 50% of measurements are below. For our purposes a 90th or 95th percentile is a really good value to report.

As the picture to the right shows, the 90th percentile is very close to the very top of the measured values. There are some measurements that are higher still, but nearly everything else is under the 90th percentile value. This is very useful when reporting system performance, since it provides a value that is effectively the “highest” measurement, but it ignores the outlier (which might well be caused by some random effect, and not normal activity).

The 95th percentile is even closer to the maximum observed value. Using the previous definition of a percentile, this tells the reader that 95 percent of all measurements were below this value.

Excel has a handy function for reporting percentiles, called: PERCENTILE. It is well worth investigating. Later on this year, I will look into the different ways that percentiles are calculated (there are subtle differences).

Posted in Blog Posts, Capacity Management | Tagged , , , , , , , | Leave a comment

Should you ever replace a planning assumption?

In the planning cycle, you start off with a load of assumptions.

Then observations are made of existing systems, and you might be tempted to say that your assumptions were wrong... but are they?

Does experience of system A automatically mean that the assumption for system B is wrong?

Alternatively, you might have made an assumption of how system C might behave in future, but then be told that it behaved in a certain way last year.... does that mean your expectations for the future HAVE to change?

As Capacity Planners, we are frequently expected to make predictions about systems or services. Often, the developers have very little idea how the system will behave, so how are we expected to know? An assumption is as good a place to start as any other.

There is always a sense of nervousness about planning assumptions. Are they valid? Are they so wrong that BIG mistakes are going to be made provisioning the infrastructure? Will many thousands of pounds be spent unnecessarily, or will not enough be provisioned and an expensive upgrade be needed within months of “Go Live”?

Surely altering planning assumptions to match historical observations is no better a way of planning than extrapolating historical activity into the future? It is the old adage of steering a ship by its wake. It'll not warn you of the rocks ahead.

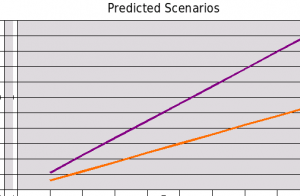
But if we don't learn from our history, then we are bound to repeat our mistakes. I propose that forecasts should have a "range". A "worst case"/"best case" view. If history is repeated, then the future will unfold in one direction. However, if the planning assumption is more applicable to the future activity, then the future will unfold in a different direction again.

The following chart shows how this could be reported. The labeling on the axis is irrelevant. It could be resource utilisation, Quality of service, or £s to be invested. The main thing is that you have a range of possibilities that allow you to evaluate the impact of the planning assumptions coming from design.

Two Potential Futures

Posted in Blog Posts, Capacity Management | Tagged , , , , , , , | 3 Comments